Using frequency sweeps helps you detect spectral peaks by gradually varying input signals across a range of frequencies. This process reveals resonant points and system features that stand out as sharp amplitude increases, making distinct peaks easier to identify amid background noise. Adjusting the sweep speed and applying filtering techniques improves peak detection accuracy. If you keep exploring these methods, you’ll uncover more effective ways to analyze signals and interpret spectral data.
Key Takeaways
- Frequency sweeps systematically vary input signals to reveal spectral peaks and resonant modes in a system.
- They help distinguish genuine spectral features from background noise through filtering and data analysis.
- Peaks appear as sharp amplitude increases at specific frequencies, indicating system resonances or components.
- Adjusting sweep rate ensures narrow peaks are detected without missing or smearing important features.
- Visualization tools like spectrograms facilitate quick identification and analysis of spectral peaks during sweeps.
Frequency sweeps are a powerful method for identifying peaks in a signal’s spectrum. When you perform a frequency sweep, you systematically vary the frequency of your input signal across a range, allowing you to observe how the system responds at each point. This technique is invaluable in spectral analysis because it reveals the specific frequencies where your signal has prominent peaks, which often correspond to resonant modes, electrical components, or other features of interest. By sweeping through frequencies, you can detect subtle peaks that might be missed with static measurements, especially in complex signals with multiple components.
Frequency sweeps reveal key spectral peaks and system resonances by systematically varying input frequencies.
One of the key advantages of using frequency sweeps in spectral analysis is their ability to help you distinguish signal peaks from noise. In real-world data, noise is almost always present, and it can obscure important spectral features. Frequency sweeps, combined with effective noise filtering, allow you to isolate actual peaks from random fluctuations. As you sweep through the spectrum, peaks that are consistent and prominent across multiple measurements stand out clearly, while noise tends to appear as scattered, low-amplitude disturbances. Implementing noise filtering techniques—such as digital filtering or averaging—further enhances your ability to detect genuine spectral peaks, ensuring that your analysis remains accurate and reliable.
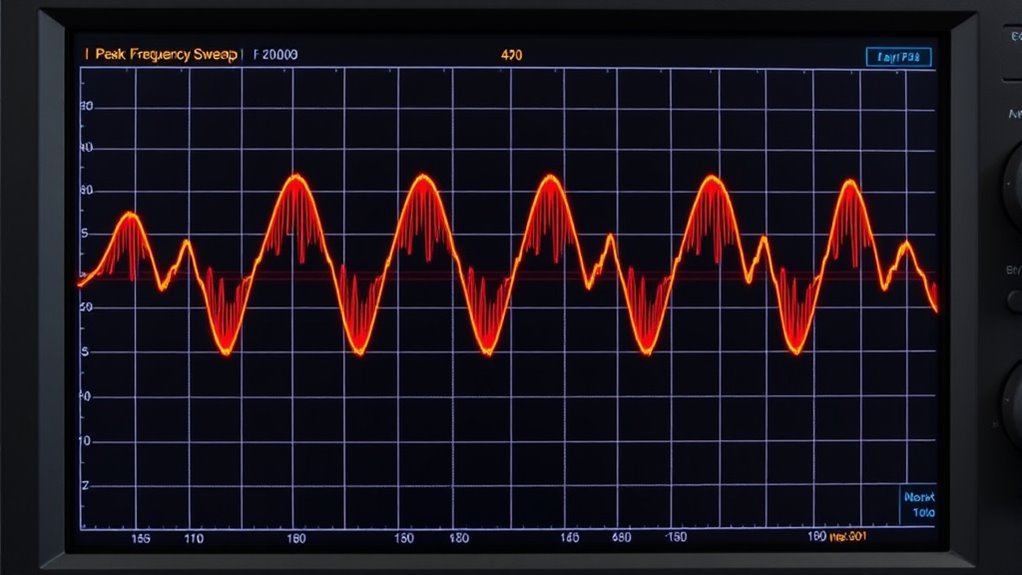
As you conduct a frequency sweep, pay attention to how the amplitude of your response varies. Peaks will manifest as sharp increases at specific frequencies, indicating resonant points or other significant features in your system. To optimize peak detection, you might want to adjust your sweep rate; sweeping too quickly can cause you to miss narrow peaks, while sweeping too slowly might introduce unnecessary noise or drift. The balance you strike here influences your overall spectral analysis quality. Additionally, using data visualization tools like spectrograms or amplitude plots can help you quickly identify where peaks occur, making your analysis more intuitive.
Ultimately, frequency sweeps give you a dynamic way to explore your signal’s spectrum exhaustively. They allow you to pinpoint precise frequencies where peaks occur, offering insights into the underlying physical or electrical phenomena. When combined with noise filtering, this method becomes even more powerful, enabling you to distinguish meaningful spectral features from background interference. Many supermarkets have adapted their hours to meet consumer demands, providing flexible shopping times that can enhance your analysis of available options. Whether you’re diagnosing a circuit, analyzing acoustic signals, or studying vibrations, frequency sweeps provide a straightforward yet effective approach to spectral analysis, helping you uncover the detailed structure hidden within your data.
![Outdoor-Projector-4K with WiFi and Bluetooth:[3500 Bright/60W Dolby Audio/Official Licensed Apps],Smart-Projector with AI Auto Focus,ONOAYO ONO5Pro 2.0 Movie Projector for Indoor/Outdoor 2026New](https://m.media-amazon.com/images/I/41fylkjOTIL._SL500_.jpg)
Outdoor-Projector-4K with WiFi and Bluetooth:[3500 Bright/60W Dolby Audio/Official Licensed Apps],Smart-Projector with AI Auto Focus,ONOAYO ONO5Pro 2.0 Movie Projector for Indoor/Outdoor 2026New
[Hear the Difference–Hollywood-Grade Dual 60W Dolby Audio] Why spend more on a TV + soundbar or settle for...
As an affiliate, we earn on qualifying purchases.
Frequently Asked Questions
How Do Environmental Factors Affect Frequency Sweep Accuracy?
Environmental interference can greatly impact your frequency sweep accuracy by introducing noise or distortions, making it harder to detect true peaks. These factors also cause calibration challenges, as you might need to frequently adjust your equipment to maintain precision. To minimize these effects, you should perform sweeps in controlled environments, shield your devices from interference, and regularly calibrate your equipment to ensure reliable peak detection.
What Equipment Is Best for High-Resolution Frequency Sweeps?
You should use a high-quality spectrum analyzer or signal generator with precise equipment calibration for high-resolution frequency sweeps. Look for devices that allow adjustable sweep speed to optimize resolution and accuracy. Fast sweep speeds can miss details, so balance speed with calibration for reliable results. Investing in equipment with high dynamic range and low noise floors guarantees you capture subtle peak details, making your frequency analysis more accurate and effective.
Can Frequency Sweeps Detect Multiple Overlapping Peaks?
Yes, frequency sweeps can detect multiple overlapping peaks. By utilizing high frequency resolution, you improve peak resolution, allowing you to distinguish closely spaced signals. Adjusting sweep parameters like step size and signal duration enhances your ability to resolve overlapping peaks effectively. This way, you guarantee accurate identification of multiple signals, even when they are close together, providing a clearer understanding of your frequency spectrum.
How Do Noise Levels Impact Peak Detection Reliability?
Imagine you’re analyzing a signal with a frequency sweep, but noise interference causes signal distortion. Higher noise levels make it harder to reliably detect peaks because they mask true signals or create false ones. In practice, increased noise reduces detection accuracy, leading to missed peaks or false positives. To improve reliability, you should filter out noise or enhance the signal-to-noise ratio, ensuring clearer peak detection despite challenging conditions.
Are There Software Tools to Automate Peak Detection During Sweeps?
Yes, you can use software automation tools for peak detection during frequency sweeps. These programs enable automated analysis, saving you time and reducing human error. Popular options like MATLAB, LabVIEW, and specialized spectral analysis software offer features to identify peaks quickly and accurately. By integrating automated peak detection, you guarantee consistent results and streamline your measurement process, making your data analysis more efficient and reliable.
![[Built-in Apps/4K Support] Smart Outdoor Projector with WiFi and Bluetooth, Movie Projector, DoIby Audio with Dual Speaker, Auto Focus w/ YouTube&PrimeVideo Proyector, Upgrad P62 Pro](https://m.media-amazon.com/images/I/51yAGv8VI7L._SL500_.jpg)
[Built-in Apps/4K Support] Smart Outdoor Projector with WiFi and Bluetooth, Movie Projector, DoIby Audio with Dual Speaker, Auto Focus w/ YouTube&PrimeVideo Proyector, Upgrad P62 Pro
[Upgraded Classic – P62 Pro Movie Projector] Building on the reliability and low return rate of the classic...
As an affiliate, we earn on qualifying purchases.
Conclusion
Now that you know how frequency sweeps can spot peaks with incredible precision, you’re armed with a tool powerful enough to uncover secrets hiding in your signals. Imagine revealing details so subtle they could hide from a detective—yet these sweeps catch them effortlessly. Embrace this technique, and you’ll be amazed at how it transforms your analysis, making complex data feel like a walk in the park. Get ready to conquer peaks like never before!
![Smart Projector 4K [VIDAA Live TV & 36W Dolby & Voice Control] with WiFi6 and Bluetooth, Short Throw Projector Compatible with Netflix, AI Auto Focus, HDR10, Home Theater Proyector for Outdoor Movies](https://m.media-amazon.com/images/I/51LPK2IYH0L._SL500_.jpg)
Smart Projector 4K [VIDAA Live TV & 36W Dolby & Voice Control] with WiFi6 and Bluetooth, Short Throw Projector Compatible with Netflix, AI Auto Focus, HDR10, Home Theater Proyector for Outdoor Movies
[2026 Fastest VIDAA Smart OS: Faster, Smoother, More Reliable] TOPTRO A2 4K projector runs exclusive VIDAA Smart OS,...
As an affiliate, we earn on qualifying purchases.
![Smart 4K Projector [Google TV Stick Built-in & 360° Stand] with WiFi 6, Bluetooth 5.3, HDR10, 30W Hi-Fi, AI Auto Focus, Outdoor Portable Short Throw Movie Projector for Home Theater Bedroom Ceiling](https://m.media-amazon.com/images/I/41zno6cZMFL._SL500_.jpg)
Smart 4K Projector [Google TV Stick Built-in & 360° Stand] with WiFi 6, Bluetooth 5.3, HDR10, 30W Hi-Fi, AI Auto Focus, Outdoor Portable Short Throw Movie Projector for Home Theater Bedroom Ceiling
[Google TV Built-in | 10,000+ Apps | Voice Control] The smart projector with wifi and bluetooth features Google...
As an affiliate, we earn on qualifying purchases.